Outcome Measurement
Sensational Kids Program Evaluation: September 2021 to April 2023
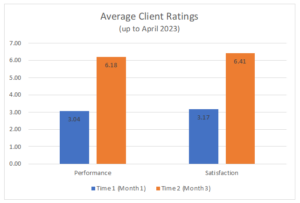
Sensational Kids’ program evaluation process began in late September of 2021, and since that time 226 clients have completed “pre-program” ratings, with 11 clients completing ratings across two services (i.e., occupational therapy and speech language therapy). Subsequent ratings are taken approximately 12 visits or three months after the previous ratings are collected. As of April 2023, across services and locations, 123 clients have follow-up data across 341 client-centered goals, suggesting the variety of needs being addressed at Sensational Kids.
Of those clients with follow-up ratings, 81% are reporting clinically meaningful changes in child performance related to individualized goals. A change score (the average difference in ratings across time) of about 2 points is considered to reflect clinically meaningful difference – that is, change that would be noticeable and impactful on daily life for a client (Cusick et al., 2007; Law, 2021). At Sensational Kids, the average change score for client ratings of goal performance is 3.05 points. These perceived gains are further supported by therapist reports of client changes over the course of treatment, which show a meaningful difference at an average of 3.06 points. Client satisfaction with child performance has also increased over the course of intervention at Sensational Kids, at an average of 3.21 points per client. Therapist satisfaction changed at an average of 3.15 points per client. These average ratings are particularly powerful considering they have remained about 3 points over time (see the table below for previous averages).
From this data, both client perception of performance on meaningful goals and their satisfaction in daily life have improved significantly over the course of intervention. Therefore, the COPM ratings document numerically the profound positive changes that therapists and clients know to be true about intervention at Sensational Kids.
Sensational Kids Program Analysis – April 26th, 2023
| April 2023 | Nov 2022 | July 2022 | |
| Clients involved in program evaluation | 226* | 151 | 93 |
| Clients with follow-up data** | 123 | 53 | 27 |
| Goals with follow-up ratings | 341 | ||
| Clients reporting meaningful change in child performance | 92 (81%) | 37 (76%) | 23 (85%) |
| Clients reporting meaningful change in satisfaction with child performance | 88 (77%) | ||
| Clients for whom therapists report clinically meaningful change in child performance | 90 (77%) | 34 (72%) | 18 (75%) |
| Clients for whom therapists report clinically meaningful change in satisfaction with child performance | 92 (78%) | ||
| Average change score for client ratings of child performance | 3.05 | 3.19 | 3.53 |
| Average change score for client ratings of satisfaction | 3.21 | 3.30 | 3.46 |
| Average change score for therapist rating of child performance | 3.06 | 3.17 | 3.31 |
| Average change score for therapist satisfaction | 3.15 | 3.23 | 3.31 |
*11 clients have ratings for two services
**Additionally, 15 clients have begun a second cycle of rating, 6 of whom already have follow-up data.
Note: All values are cumulative over time.
Note: as of 2021, a change of 2+ points is considered clinically meaningful for performance ratings (Cusick et al., 2007; Law, 2021).
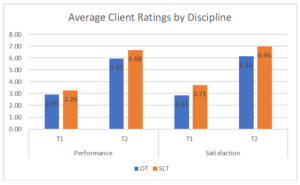
Comparing OT and SLT Services
| OT | SLT | |||
| April 2023 | Nov 2022 | April 2023 | Nov 2022 | |
| # of clients with completed T2 ratings | 76 | 27 | 47 | 23 |
| Average change in client performance ratings | 3.05 | 2.85 | 3.07 | 3.59 |
| Average change in client satisfaction ratings | 3.31 | 3.11 | 3.03 | 3.54 |
| Average change in therapist performance ratings | 2.85 | 2.48 | 3.37 | 3.83 |
| Average change in therapist satisfaction ratings | 2.97 | 2.58 | 3.43 | 3.87 |
| # clients reporting significant performance change | 63 (83%) | 18 (67%) | 29 (76%) | 19 (83%) |
| # clients reporting significant satisfaction change | 60 (79%) | 18 (67%) | 28 (74%) | 18 (78%) |
| # therapists reporting significant performance change | 54 (77%) | 14 (61%) | 36 (77%) | 20 (80%) |
| # therapists reporting significant satisfaction change | 56 (79%) | 14 (61%) | 36 (77%) | 20 (80%) |
Note that denominators for percentages change given how many clients have that rating type (for example, some clients have only client and no therapist ratings).
References
Cusick, A., Lannin, N. A., & Lowe, K. (2007). Adapting the Canadian Occupational Performance Measure for use in a paediatric clinical trial. Disability and Rehabilitation, 29(10), 761–766. https://doi.org/10.1080/09638280600929201
Cusick, A., McIntyre, S., Novak, I., Lannin, N., & Lowe, K. (2006). A comparison of Goal Attainment Scaling and the Canadian Occupational Performance Measure for paediatric rehabilitation research. Pediatric Rehabilitation, 9(2), 149–157. https://doi.org/10.1080/13638490500235581
Komar, A., Ashley, K., Hanna, K., Lavallee, J., Woodhouse, J., Bernstein, J., Andres, M., & Reed, N. (2016). Retrospective analysis of an ongoing group-based modified constraint-induced movement therapy program for children with acquired brain injury. Physical & Occupational Therapy In Pediatrics, 36(2), 186–203. https://doi.org/10.3109/01942638.2015.1076557
Law, M. C. (2021). Frequently asked questions: COPM. Retrieved July 30, 2021, from https://www.thecopm.ca/faq/
Law, M. C., Baptiste, S., Carswell, A., McColl, M., Polatajko, H., & Pollock, N. (2000). Canadian occupational performance measure (3rd ed.). CAOT Publications ACE.
Verhoef, J. A., Roebroeck, M. E., van Schaardenburgh, N., Floothuis, M. C., & Miedema, H. S. (2014). Improved occupational performance of young adults with a physical disability after a vocational rehabilitation intervention. Journal of Occupational Rehabilitation, 24(1), 42-51. https://doi.org/10.1007/s10926-013-9446-9
Wressle, E., Lindstrand, J., Neher, M., Marcusson, J., & Henriksson, C. (2003). The Canadian Occupational Performance Measure as an outcome measure and team tool in a day treatment programme. Disability & Rehabilitation, 25(10), 497-506.


